Foreca Weather Maps
In the following, you can find information about the most used weather maps Foreca provides. All the maps can be animated with a seamlessly continuing sequence of images (time steps). Any map using the standardised tile indexes can be used as the background for the weather overlays. In addition to the weather layers below, don’t hesitate to ask for any other weather maps or their combinations. For instance, all the layer colours, timelines and time steps are customisable with only some limitations.
Precipitation Maps
All the Foreca precipitation maps show the intensity of precipitation separated by colour tone levels. The layers contain all types of precipitation like rain, sleet and snow. The precipitation type can be separated and expressed by different colour schemas.
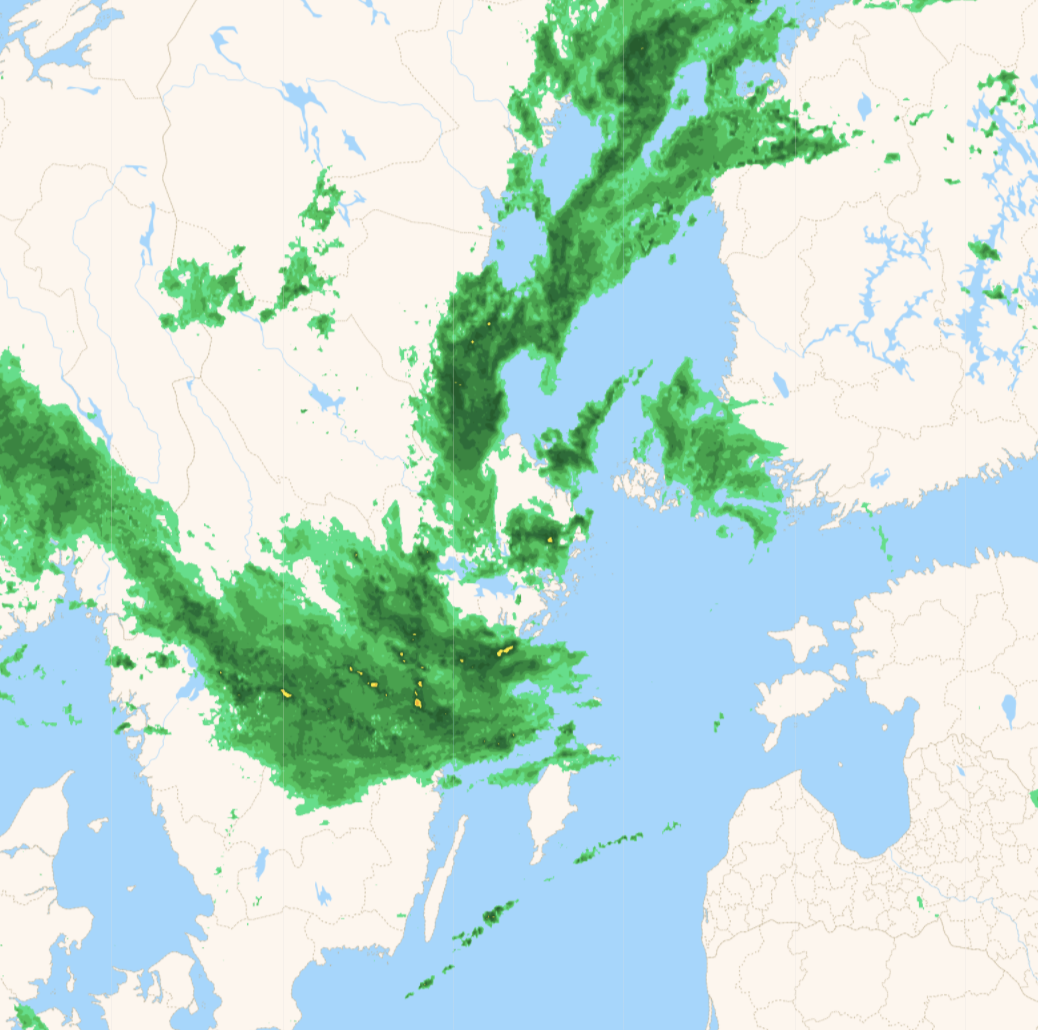
Radar Image Map
Radar images show the real-time movement of precipitation (rain/snow) detected by weather radars.
Radar is available for limited geographical areas only.
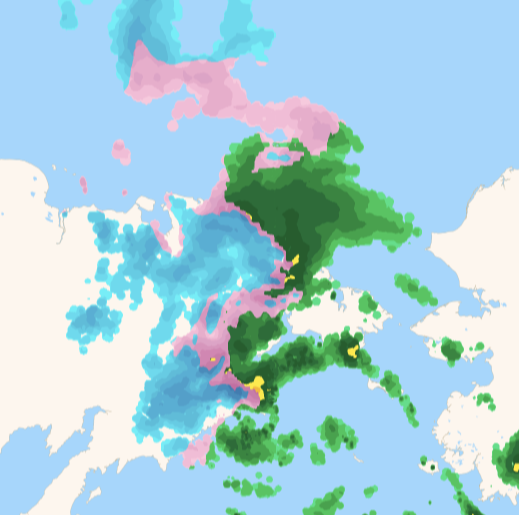
Radar Image Map with Precipitation Type
The same specifications of the previous map product, but with the example picture of precipitation type separated (rain, sleet, snow)
Radar is available for limited geographical areas only.
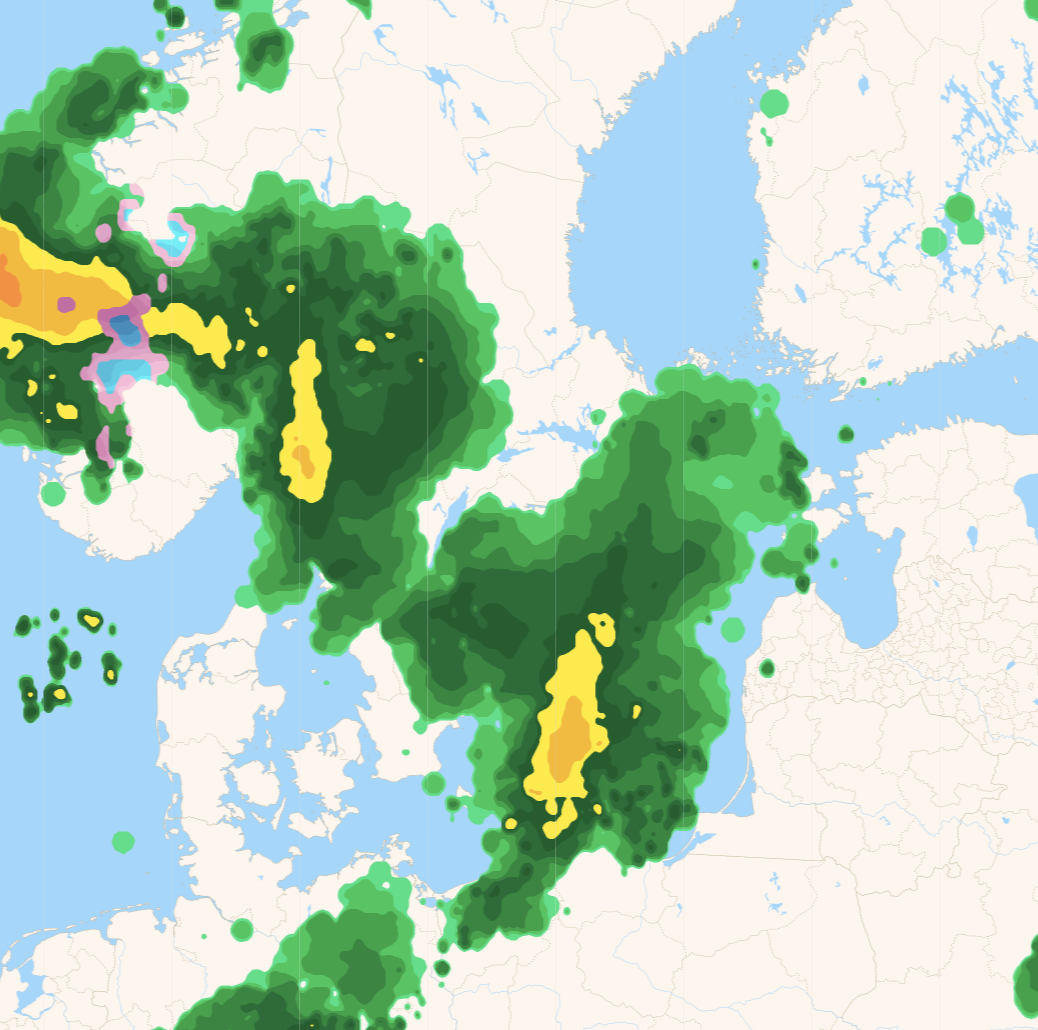
Radar Forecast Map
Radar Forecast Map. Radar forecast extrapolated for the following hours from the latest radar images. Foreca predicts how the observed rain front moves to create a continuous series of images for up to 2 following hours. This forecast is commonly used as a visually seamless continuation from radar images.
Radar is available for a limited number of geographical areas only. For further information, please contact us.
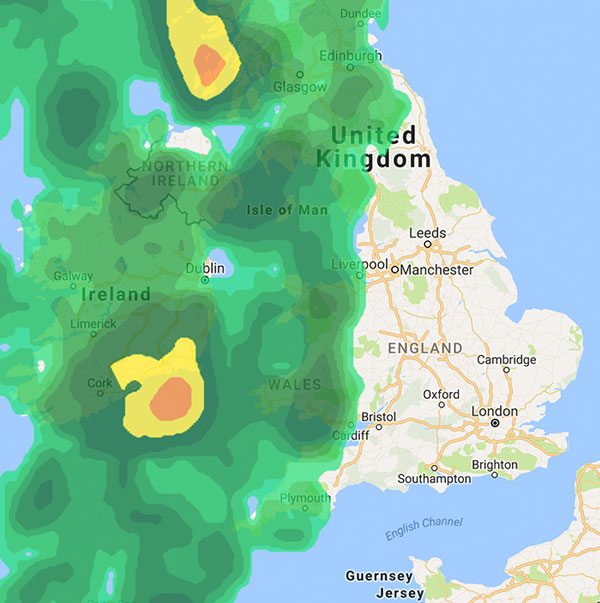
Forecast Map
Precipitation forecast maps use coloured contours to show the forecasted rain/snow. Precipitation forecast maps are based on atmospheric forecast model data.
Coverage is global.
Cloudiness Maps
Cloudiness maps provide information of cloud movements as forecasted or observed from weather satellites.
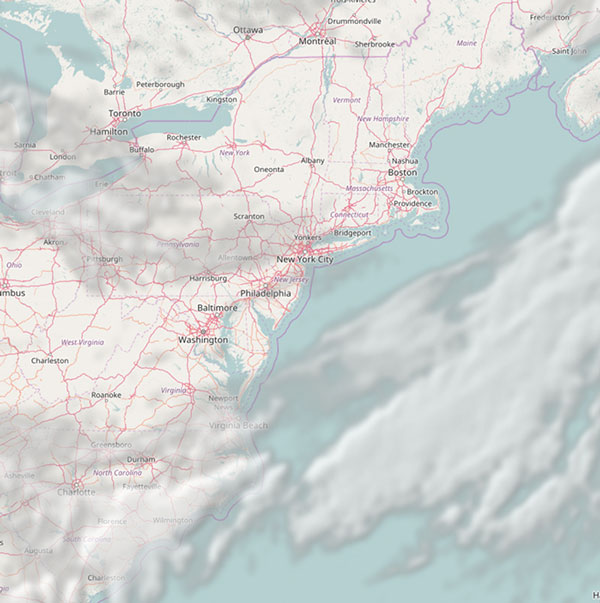
Satellite Image Map
Satellite images show the movement of clouds photographed from space by the weather satellites.
Global satellite images with the whole world on the same map is a real attention grabber. In satellite images, you can observe cloud movements for larger areas, which enables you to see big weather phenomena at a glance. You can spot hurricanes and deep low pressures and sometimes even estimate their tracks.
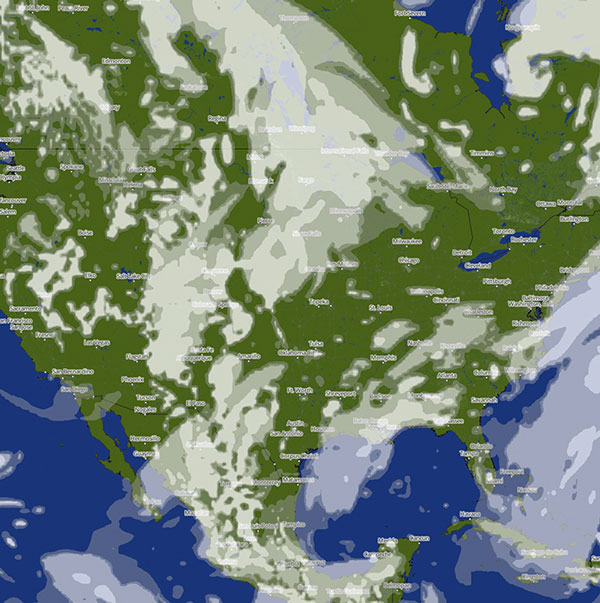
Forecast Map
Cloudiness forecast maps use coloured contours to show the forecasted cloudiness.
Available globally.
Temperature Maps
Temperature forecast maps show the forecasted temperature on the map for upcoming days. The temperature can be visualised with numbers and/or colours to make the forecast easy to read
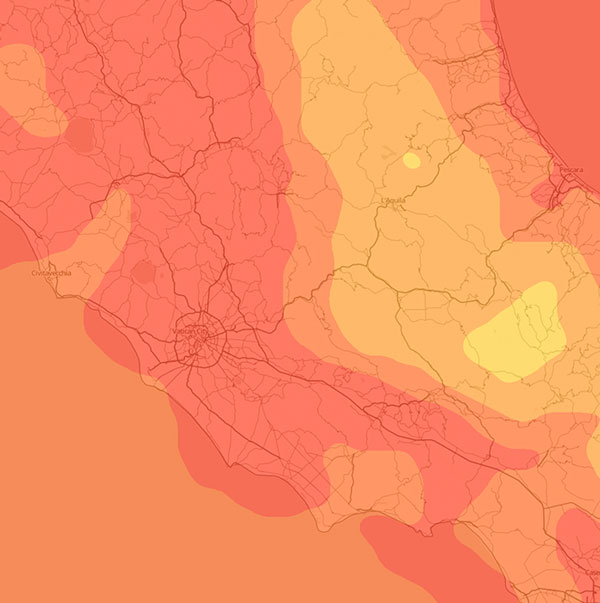
Forecast Map
Temperature forecast maps show the forecasted temperatures on the map.
Available globally.
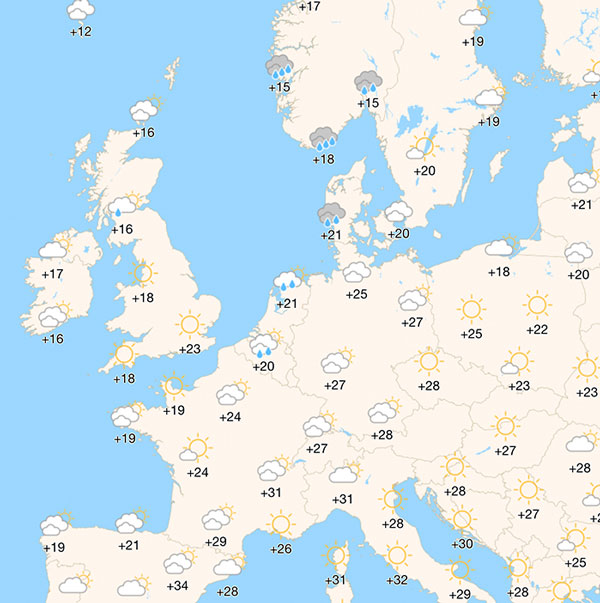
Weather Symbol Map
Symbol maps provide an overview forecast with graphical icons and temperatures
Available soon!
Wind Maps
Don't hesitate to ask for any other weather maps regarding your needs. Some examples of the following:
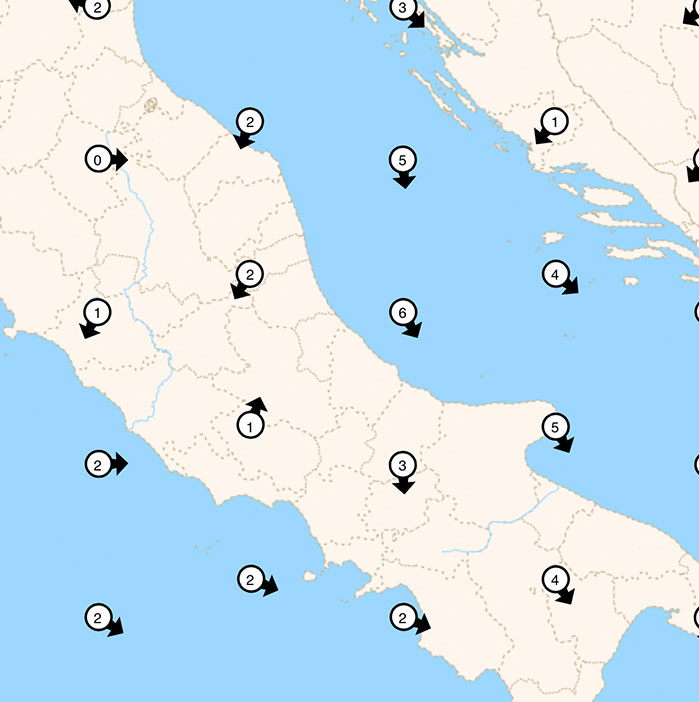
Wind symbol with speed and direction
Wind forecast maps use arrows and numbers to show the direction and speed of wind. The wind strength can also be visualised as colours. All the sea/ocean areas are also covered, making wind maps useful, especially for boating and sailing enthusiasts.
Available globally.
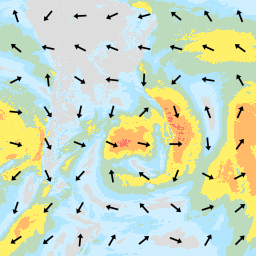
Wind layer
Wind forecast maps use arrows and colours to show the direction and strength of wind. All the sea/ocean areas are also covered, making wind maps useful, especially for boating and sailing enthusiasts.
Available globally.
Other Weather Maps
Don't hesitate to ask for any other weather maps regarding your needs. Some examples of the following:
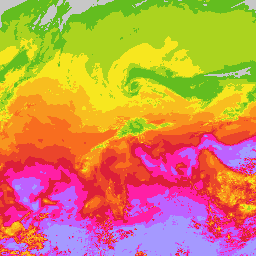
UV Map
UV-index maps show the UV-index as colours on the map.
Available globally.
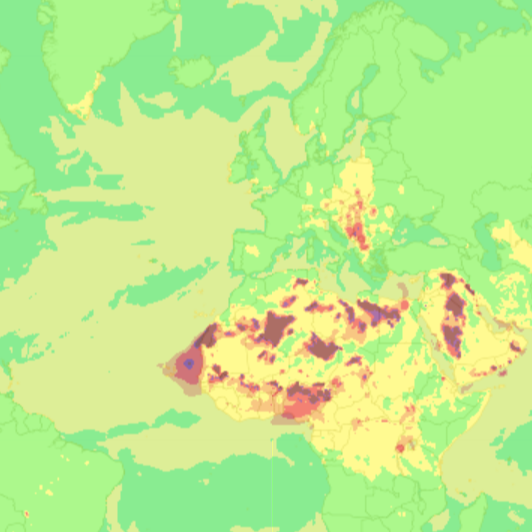
Air quality index
Air quality index map show the air quality as colours on the map.
Available globally
Sea temperature
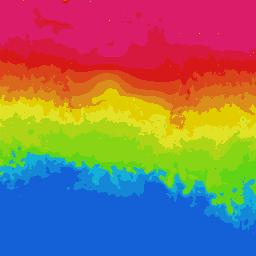
Sea temperature maps show the sea temperatures as colours on the map. Land areas are also covered.
Available globally.
Approximate snow depth
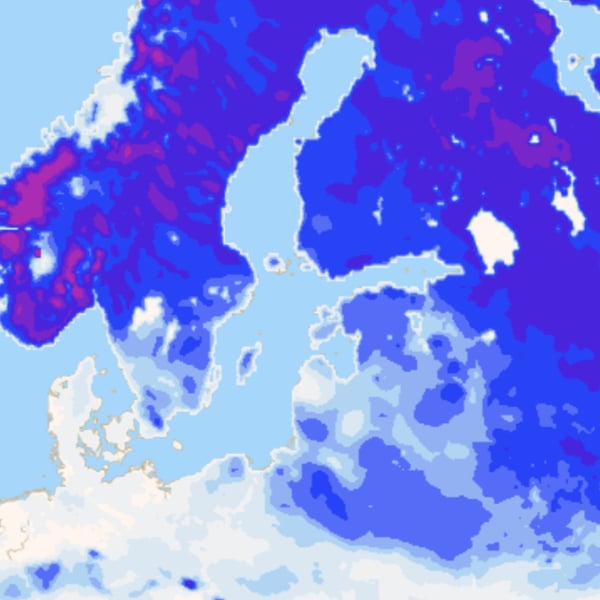
Approximate snow depth maps show the snow depth as colours on the map.
Available globally.
Mean sea pressure (contour)
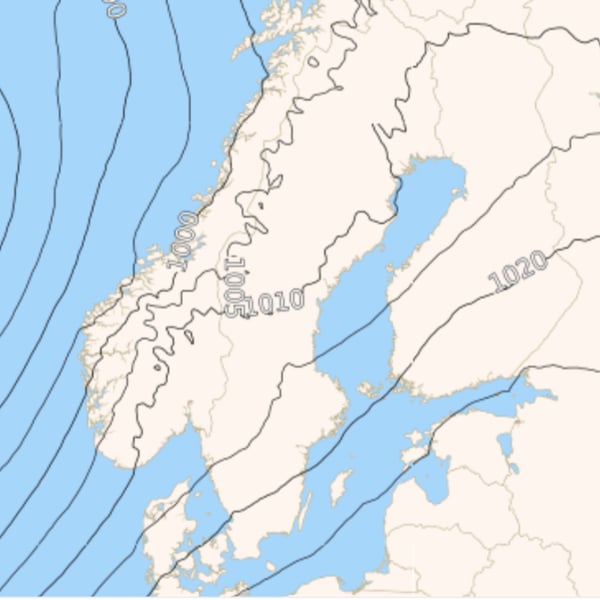
Air pressure forecast maps show the air pressure forecasts for upcoming days as contour map. From these maps, the user can spot, for instance, important low-pressure and high-pressure centres and their movements. For air pressure contour maps, the cloudiness and/or precipitation forecasts are often added.
Available globally.
Mean sea pressure (colored)
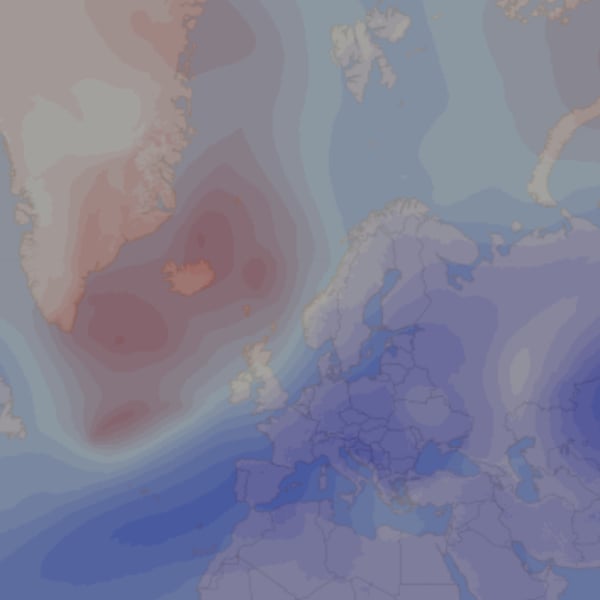
Air pressure forecast maps show the air pressure forecasts for upcoming days as colored map . From these maps, the user can spot, for instance, important low-pressure and high-pressure centres and their movements.
Available globally.